Datatype: Shapefiles#
A shapefile is an Esri vector data storage format for storing the location, shape, and attributes of geographic features. It is stored as a set of related files and contains one feature class.#
For this example, we are using the inventory.shp file.
To open a shapefile, you need the geopandas library.
If you are Windows, go through the following steps to install the required libraries:
Using your cmd, install wheel
pip install *.whl
Go to Unofficial Windows Binaries for Python Extension Packages
Download on a specific folder the following binaries: GDAL, Pyproj, Fiona, Shapely and Geopandas matching the version of Python, and whether the 32-bit or 64-bit OS is installed on your laptop.
Go to the folder where the binaries are downloaded.
Follow the order of installation and make sure the filename is correct with respect to the one you have downloaded.
pip install .\GDAL-3.1.1-cp37-cp37m-win_amd64.whl
pip install .\pyproj-2.6.1.post1-cp37-cp37m-win_amd64.whl
pip install .\Fiona-1.8.13-cp37-cp37m-win_amd64.whl
pip install .\Shapely-1.7.0-cp37-cp37m-win_amd64.whl
pip install .\geopandas-0.8.0-py3-none-any
For example, for Python v3.7x (64-bit), GDAL package should be GDAL‑3.1.2‑cp37‑cp37m‑win_amd64.whl.
For linux and MacOS based systems, run the following command in your terminal:
shell conda install geopandas
After installing the libraries correctly, follow the given steps to open the shapefile.
Import geopands library as gpd.
import geopandas as gpd
Use the read_file function and pass the file location as a parameter to it.
gdf = gpd.read_file("inventory.shp")
3. Use print statement to return the attribute table.
print(gdf)
                                              geometry
0    POLYGON ((-88.46429 17.33493, -88.45598 17.334...
1    POLYGON ((-88.53911 17.30164, -88.52248 17.301...
2    POLYGON ((-88.56405 17.20178, -88.55574 17.201...
3    POLYGON ((-88.63056 17.14353, -88.61393 17.143...
4    POLYGON ((-88.83839 17.10192, -88.83008 17.101...
..                                                 ...
96   POLYGON ((-88.83008 17.01038, -88.81345 17.010...
97   POLYGON ((-89.07117 16.21981, -89.05454 16.219...
98   POLYGON ((-89.08779 16.21981, -89.07948 16.219...
99   POLYGON ((-89.20418 16.17820, -89.17093 16.178...
100  POLYGON ((-88.45598 17.35157, -88.43935 17.351...

[101 rows x 1 columns]
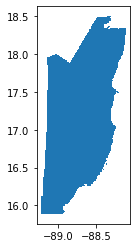
Use matplotlib to plot the map
%matplotlib inline
gdf.plot()
<AxesSubplot:>
